Analysing Resource Allocation
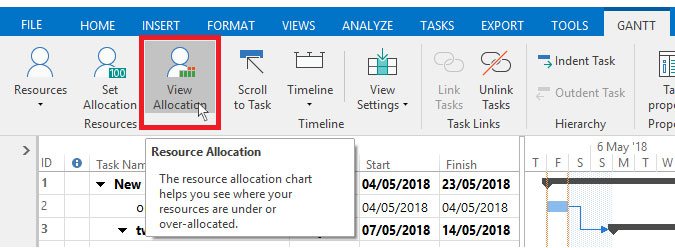
You can analyse resource allocation using the allocation chart, which is available whilst viewing your map as a Gantt chart. To turn on the allocation chart switch to the Gantt ribbon and click Resource Allocation.
The allocation chart shows where your resources are over-allocated, under-allocated or allocated 100%.
For more information on the allocation chart it is recommended to take a few minutes to read the help documentation. To access the help documentation in MindGenius press F1, then use the tree to navigate to User Guide\Using the Gantt View\Analysing Resource Usage.
Need More Information?
If you’d like to find out more about using MindGenius Online within your team, check out our blog post or enquire about a team trial by booking a demo with a member of our team below.